
Order Flow
Tools for reading liquidity, aggressive participation and execution pressure.
Deepantra Tools Library
Explore the tools behind ProChart: order flow, market depth, footprint, reaction zones, classic indicators and AI-assisted market context.
Not just indicators layered on price. Deepantra connects chart tools to the market data beneath price.
Tools for reading liquidity, aggressive participation and execution pressure.
Historical reaction zones and market memory context.
Ask what changed, where liquidity sits and how order flow shifted.
Fair value, volatility and participation context.
EMA, SMA, Bollinger Bands, RSI, MACD, Volume and ATR.
Browse
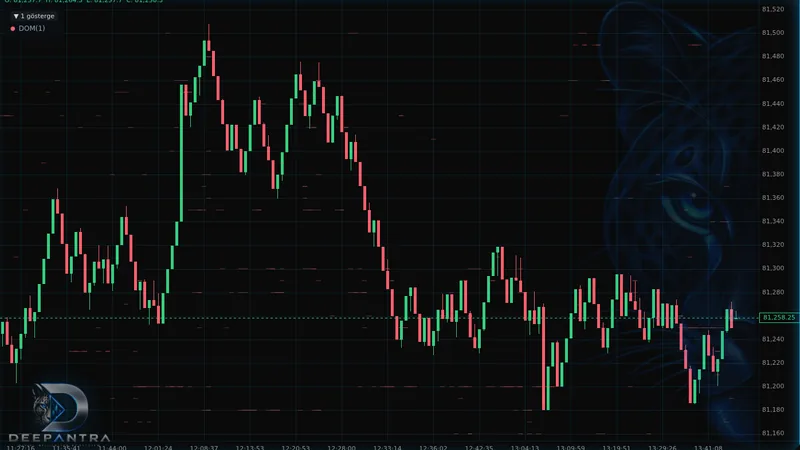
Order Flow
Track historical liquidity levels and where large resting depth appeared across the chart.
Learn more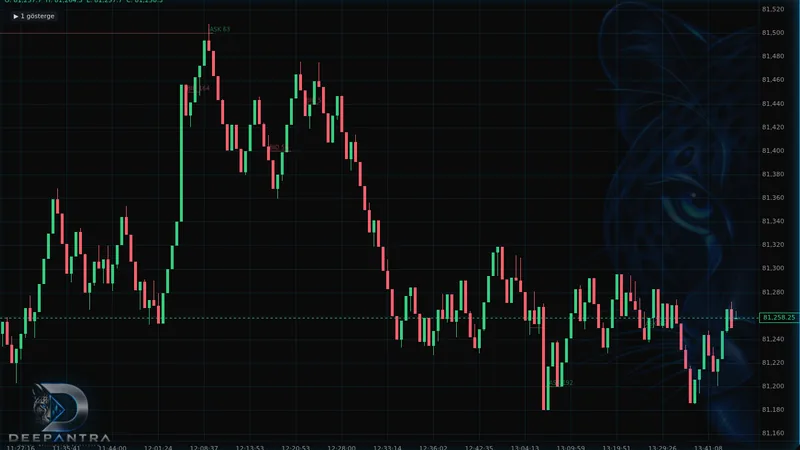
Order Flow
See where aggressive buy and sell activity concentrated inside range bars on the footprint chart.
Learn more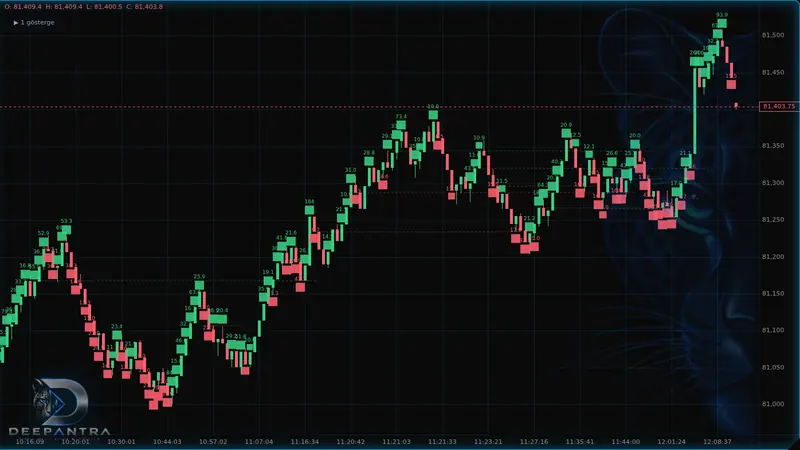
Order Flow
Spot unusually large trade activity and clusters that may reveal stronger participation.
Learn more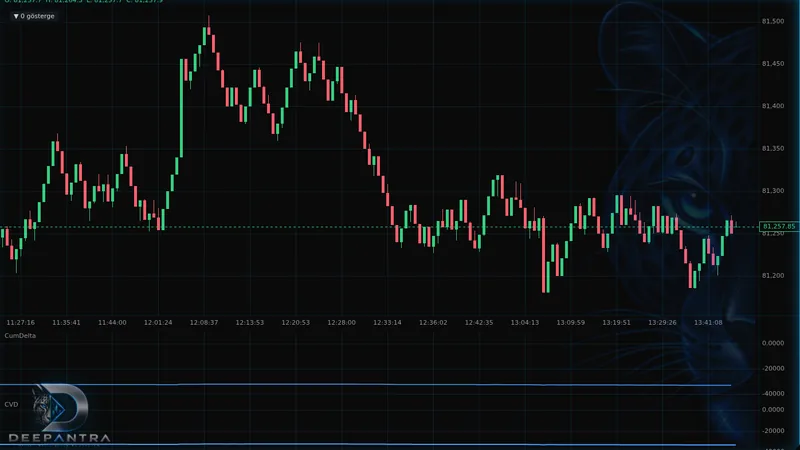
Order Flow
Follow the balance between aggressive buying and selling across market moves.
Learn more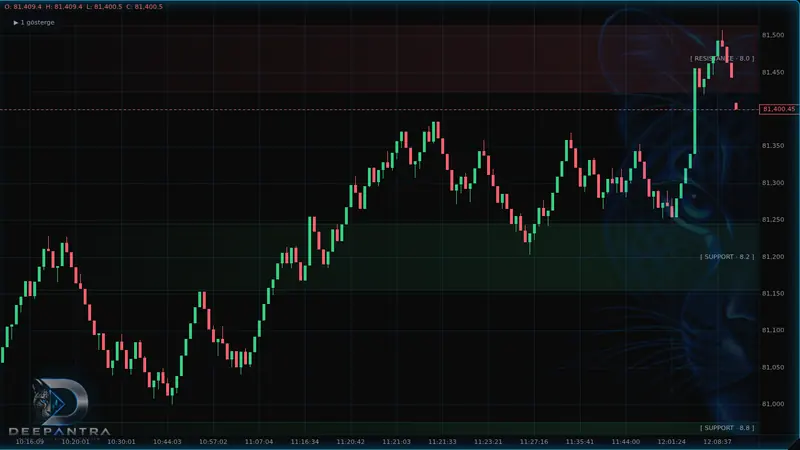
Reaction Intelligence
Highlights areas where past liquidity and order-flow activity produced meaningful market reactions.
Learn more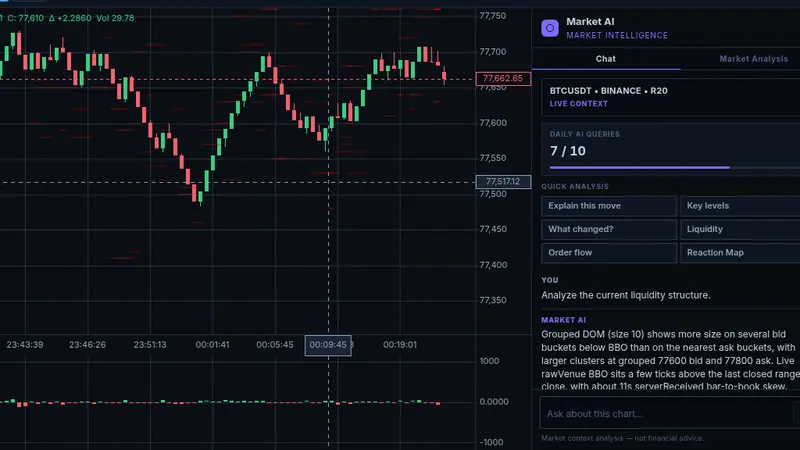
AI Context
Ask what changed, where liquidity sits and how order flow shifted — grounded in the active chart context.
Learn more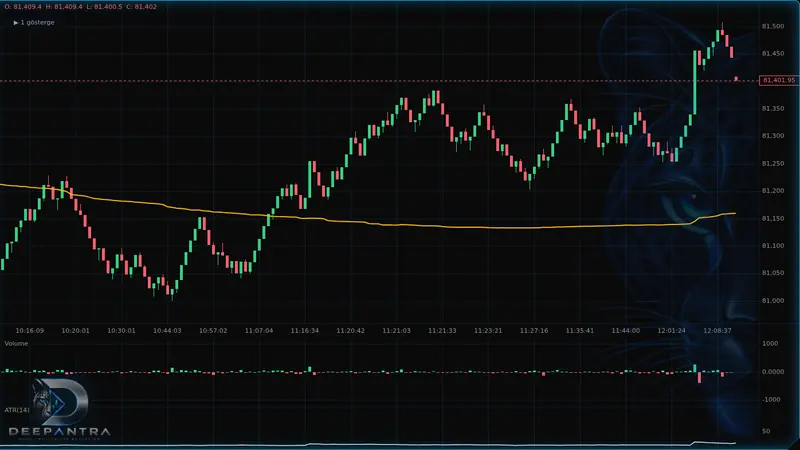
Professional Context
Use VWAP, ATR and volume tools alongside order-flow data to understand structure and volatility.
Learn more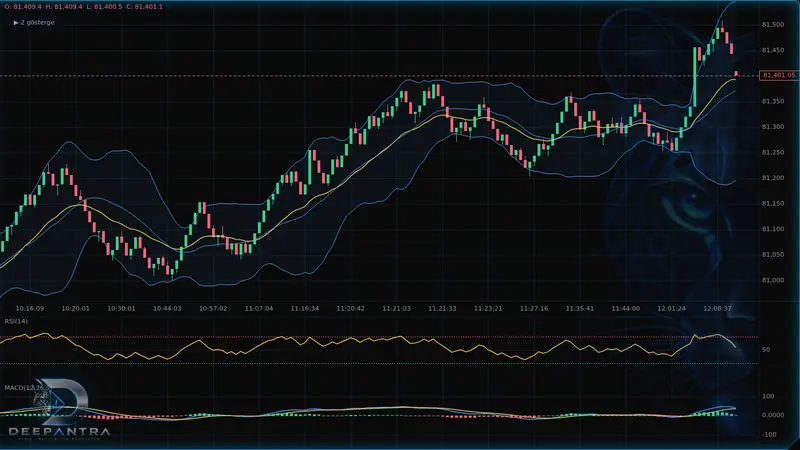
Classic Indicators
EMA, SMA, Bollinger Bands, RSI, MACD and volume tools for traditional chart analysis.
Learn moreData chain
Depth, trades and footprint feed the same ProChart workspace — so DOM Lines, Footprint Lines, Reaction Map and Market AI share one coherent market picture.
Availability
Classic indicators start free. Order-flow and AI tools unlock on Pro and Elite. Tier badges on each card show where a tool sits.