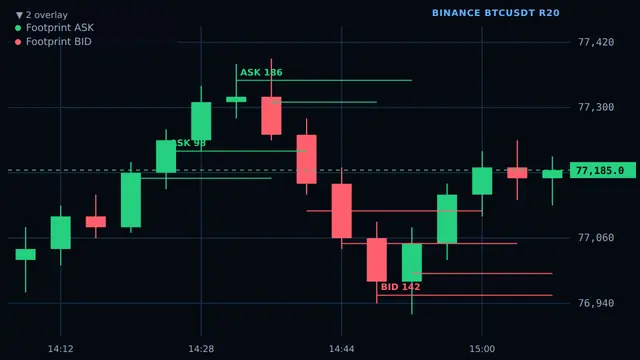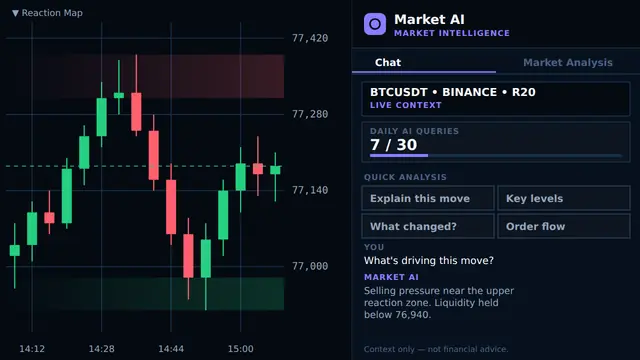
Market Intelligence Tools

Delta & CVD — Buy/Sell Pressure Context

PRO / ELITE

Delta and CVD help follow the balance between aggressive buying and selling.

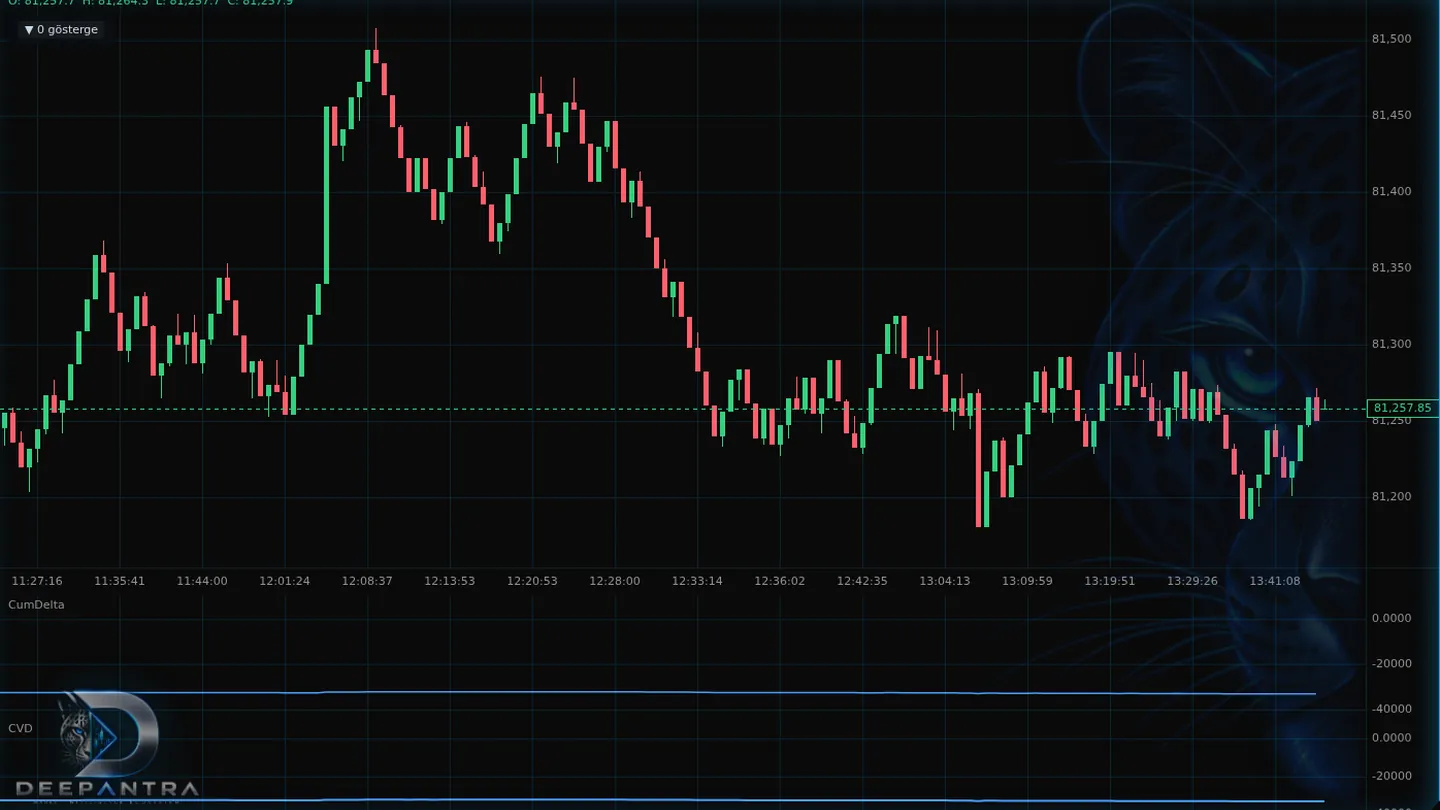
ProChart Delta and CVD panel showing buy and sell pressure across a BTCUSDT move
ProChart workspace

What it is

Delta measures the near-term balance of aggressive buying versus selling. CVD accumulates that balance so you can follow participation through a move. Together they add pressure, absorption and divergence context beside price — they do not tell you what to do next.
What it helps you see

  • Buy/sell pressure
  • Absorption context
  • Divergence context
  • Trend participation

How to read it

  1. Delta describes which side was more aggressive in a bar or window.
  2. CVD traces the cumulative path of that aggressive balance over time.
  3. Price moving while delta cools can be absorption context to read with footprint.
  4. Price and CVD moving differently is divergence context, not a trade cue.
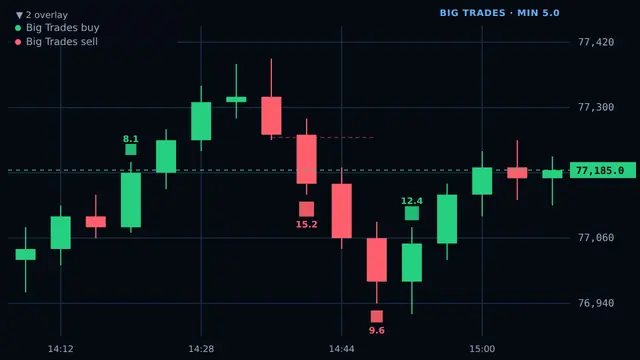
  5. Use both as participation context alongside Big Trades and Footprint Lines.

Example on chart

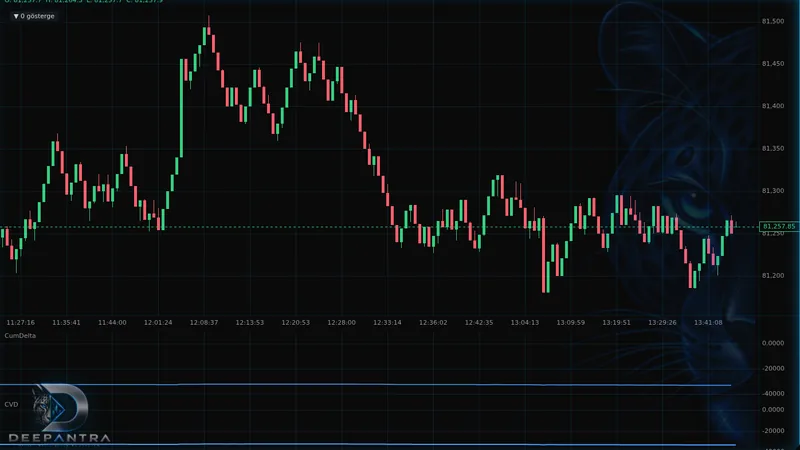
Delta may stay one-sided while price moves through a range, while CVD traces the cumulative balance of aggressive buying versus selling. If price extends and delta cools, that is absorption and participation context to read alongside the footprint — not an entry cue.

Example ProChart Delta histogram and CVD line used as buy/sell pressure context on BTCUSDT

Key parameters / controls

  • Reset period — When CVD starts a fresh cumulative window, such as a session.
  • Display mode — Show a delta histogram, a CVD line, or both.
  • Smoothing — Optional averaging so short bursts are easier to read.
  • Session versus continuous — Follow one session’s balance or a longer running total.
  • Divergence highlight — Visual cue when price path and CVD path differ — still context, not a call.

Package availability

Available on PRO and ELITE.

PRO / ELITE

Deepantra tools support analysis and practice. They do not guarantee outcomes.