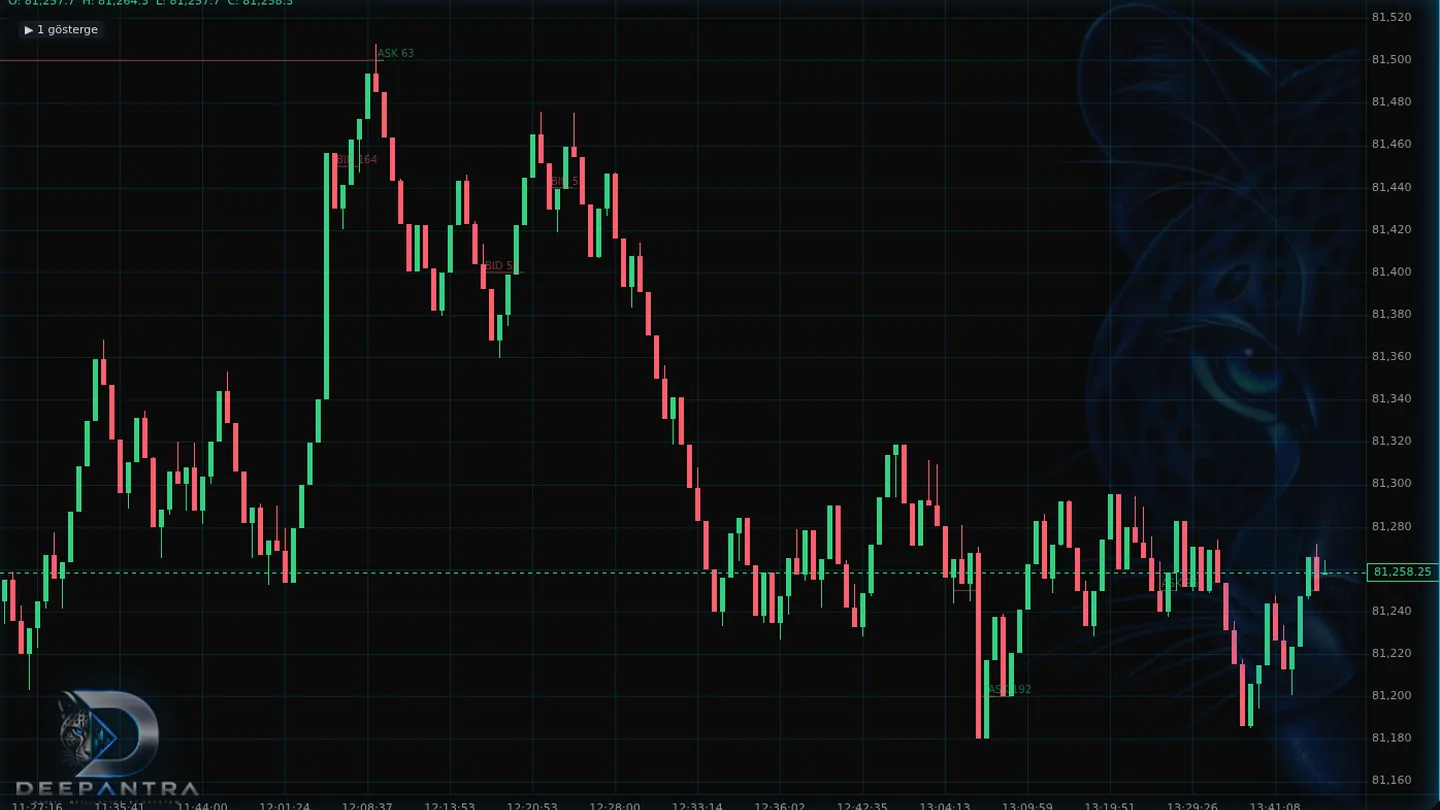
What it is
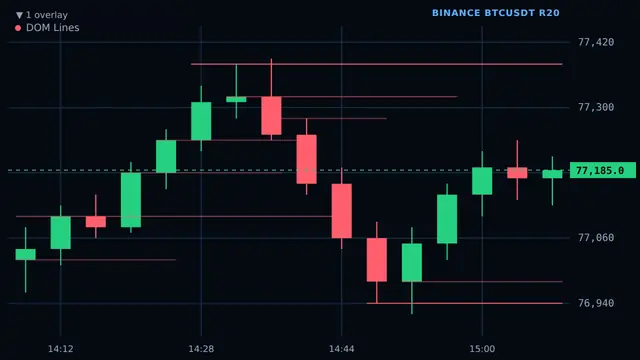
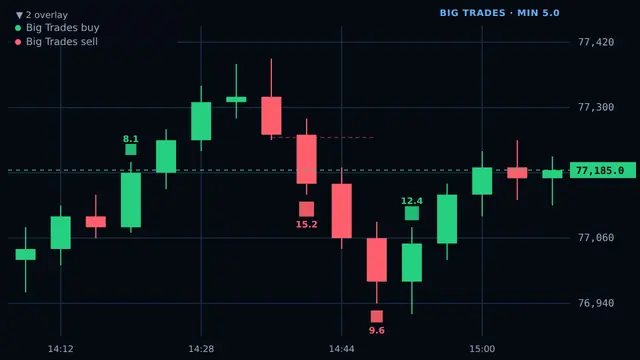
Footprint Lines overlay aggressive buy and sell activity from the footprint chart onto price. They show where ask-side and bid-side participation concentrated inside range bars. That is execution context — who was active at a level — not a forecast of the next bar.