Market Intelligence Tools

Classic Chart Indicators

FREE

Traditional technical indicators remain useful, but Deepantra connects them with deeper market data and order-flow context.

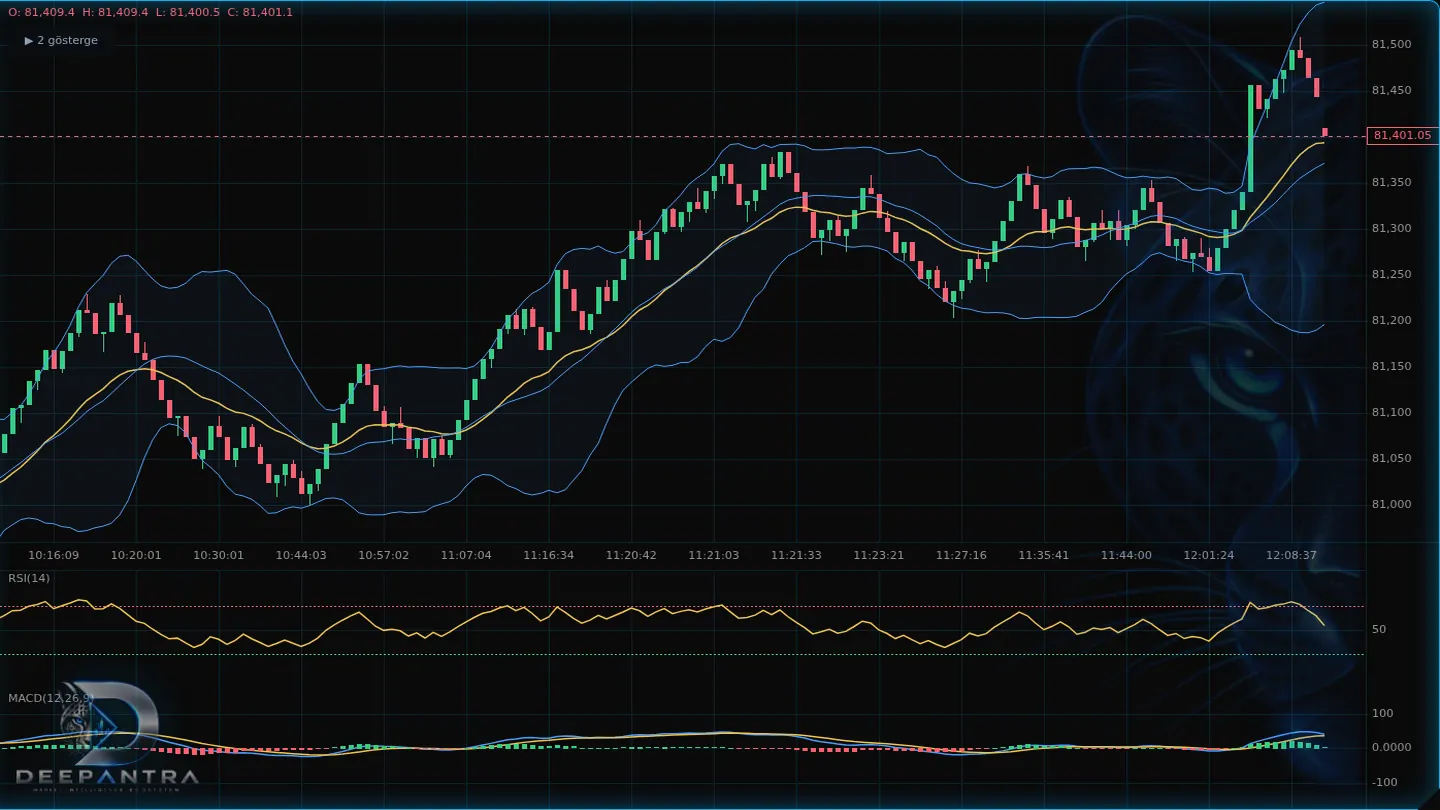
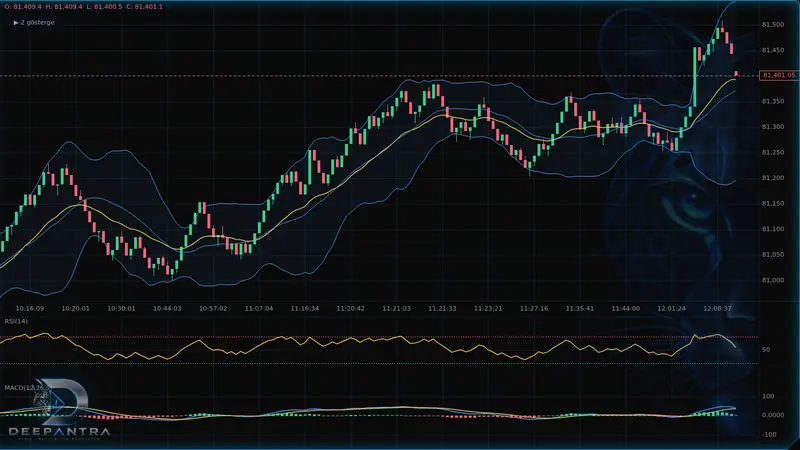
ProChart classic indicators including EMA, SMA, Bollinger Bands and RSI on a BTCUSDT chart
ProChart workspace

What it is

Classic Chart Indicators cover the familiar toolkit: EMA, SMA, Bollinger Bands, RSI, MACD, volume and ATR. They remain useful for trend, momentum and volatility context. On Deepantra they sit in the same workspace as depth, footprint and reaction memory, so a traditional reading has more behind it.

What it helps you see

  • Trend context
  • Momentum
  • Volatility
  • Traditional analysis

Classic indicators

EMA

An exponential moving average that weights recent price more heavily. Use it as trend and location context.

SMA

A simple moving average of the chosen period. A slower reference for where price has averaged.

Bollinger Bands

A moving average with a volatility envelope. The width describes range expansion or compression.

RSI

A momentum oscillator for recent advance versus decline. Context for stretch, not a standalone call.

MACD

A moving-average comparison used as momentum context, including histogram and signal line.

Volume

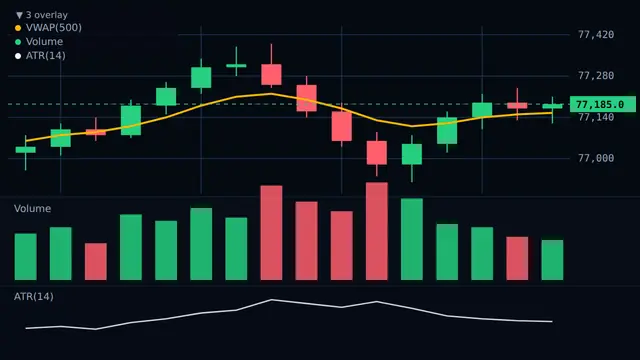
Participation intensity for each bar, useful next to classic overlays and order-flow tools.

ATR

Average true range as volatility and range context for recent bars.

How to read it

  1. EMA and SMA describe the slope and location of recent price.
  2. Bollinger Bands outline volatility width around a moving average.
  3. RSI and MACD summarize momentum context; they do not rank a trade.
  4. Volume and ATR add participation and range context beside those overlays.
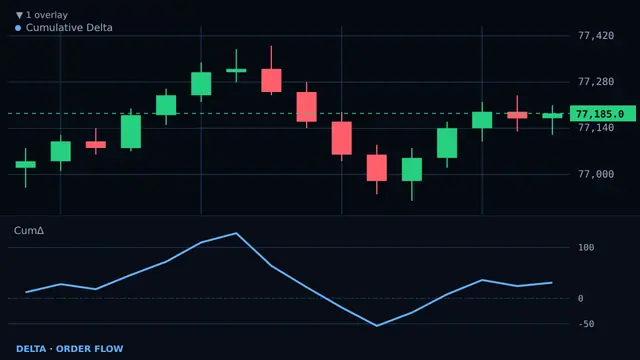
  5. Read classic tools together with order-flow layers when you need more than price.

Example on chart

EMA and SMA can describe the slope of recent price, while Bollinger Bands outline volatility width and RSI or MACD summarize momentum. On Deepantra those layers sit on the same chart as depth and order flow, so traditional readings have more context around them.

Example ProChart chart with EMA, SMA, Bollinger Bands, RSI and MACD used as traditional context on BTCUSDT

Key parameters / controls

  • Period — Lookback used by EMA, SMA, RSI, MACD, ATR and related tools.
  • Source — Price input for the calculation, typically close.
  • Overlay versus pane — Draw on price (EMA, SMA, Bollinger Bands) or in a lower pane (RSI, MACD, volume).
  • Band width — For Bollinger Bands, how far the volatility envelope sits from the average.
  • MACD lines — Fast, slow and signal periods used for the MACD momentum view.

Package availability

Available on FREE.

FREE

Deepantra tools support analysis and practice. They do not guarantee outcomes.