Market Intelligence Tools

Big Trades — Large Activity Clusters

PRO / ELITE

Big Trades helps identify unusually large trade activity and clusters that may indicate stronger participation.

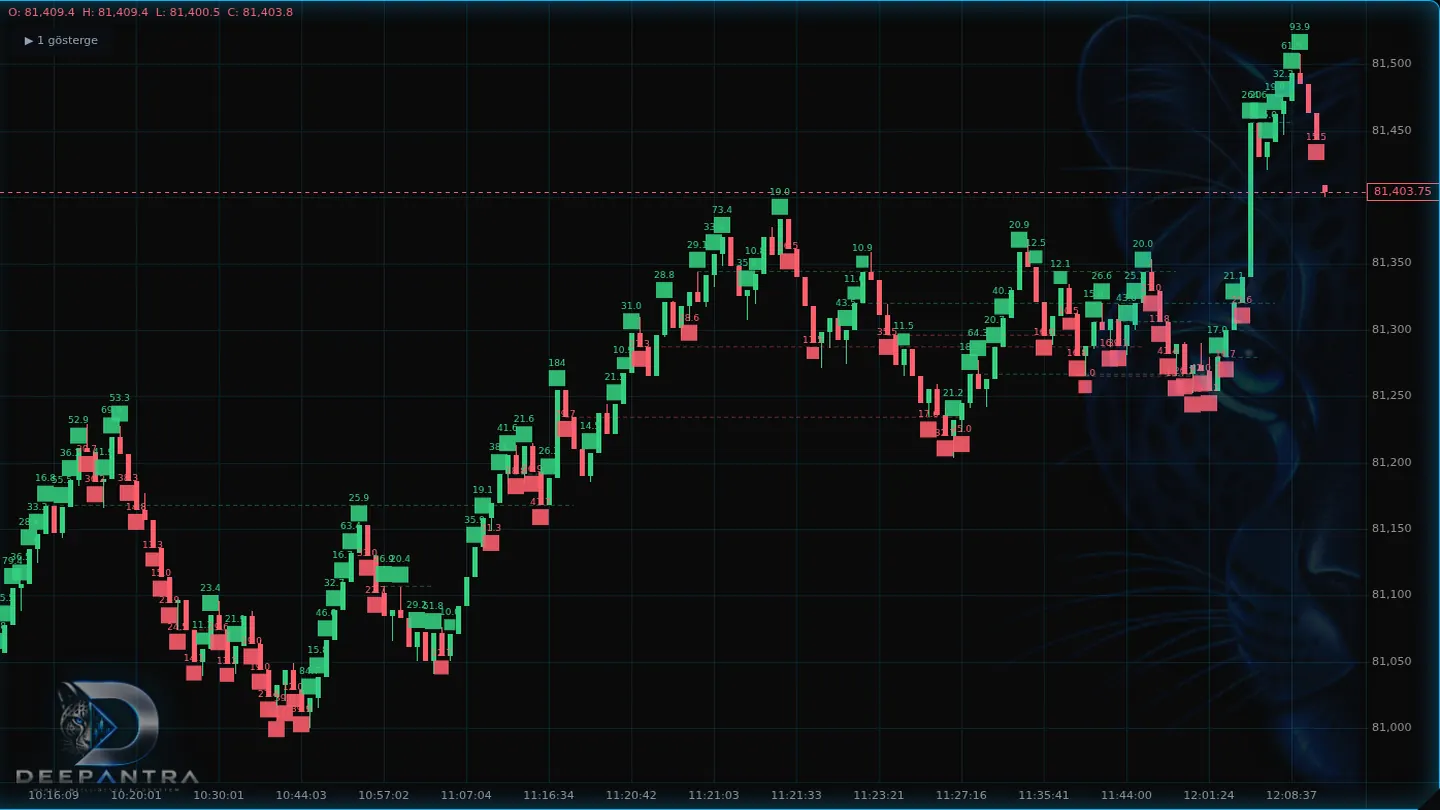
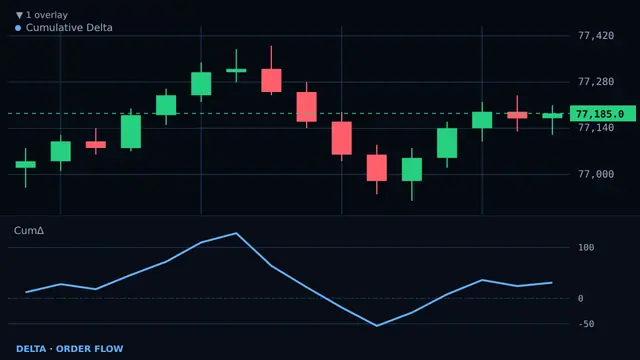
ProChart Big Trades overlay marking large buy and sell executions on a BTCUSDT chart
ProChart workspace

What it is

Big Trades highlights unusually large executions and clusters on the chart. Those prints can show where participation stepped up compared with nearby activity. Use them as execution context and a participation map — not as a momentum call.
What it helps you see

  • Large execution
  • Activity clusters
  • Momentum context
  • Participation shifts

How to read it

  1. A marker flags an execution that is large relative to nearby activity.
  2. Clusters of markers can show a burst of participation in a short window.
  3. Side coloring describes whether large prints hit the bid or the ask.
  4. Compare quiet stretches with clustered prints to read participation shifts.
  5. Large activity is context for what traded, not a direction forecast.

Example on chart

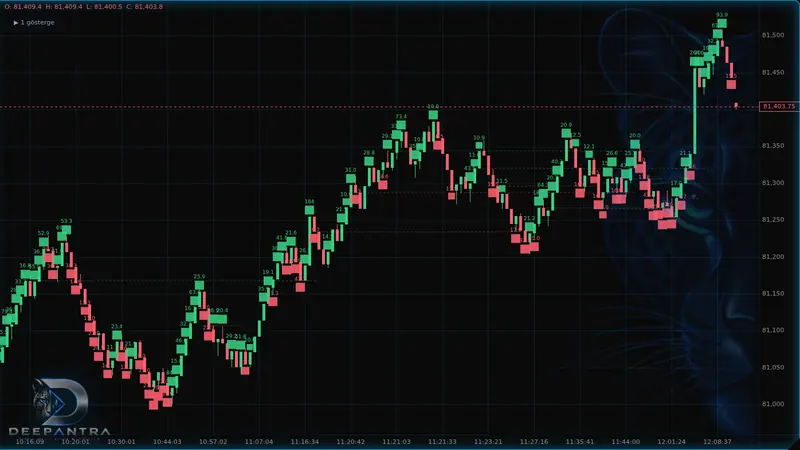
A cluster of Big Trades markers may appear during a fast stretch of a range, showing unusually large executions compared with nearby bars. Later, quieter prints can show participation cooling. That shift is activity context, not a call to chase the move.

Example ProChart chart with Big Trades markers clustered during a high-participation stretch on BTCUSDT

Key parameters / controls

  • Size filter — Minimum execution size that qualifies as a big trade.
  • Cluster window — How closely large prints must sit to be read as a cluster.
  • Side display — Show large bid-side prints, ask-side prints, or both.
  • Time range — How far back big-trade markers remain on the chart.
  • Highlight intensity — Visual emphasis for isolated prints versus dense clusters.

Package availability

Available on PRO and ELITE.

PRO / ELITE

Deepantra tools support analysis and practice. They do not guarantee outcomes.