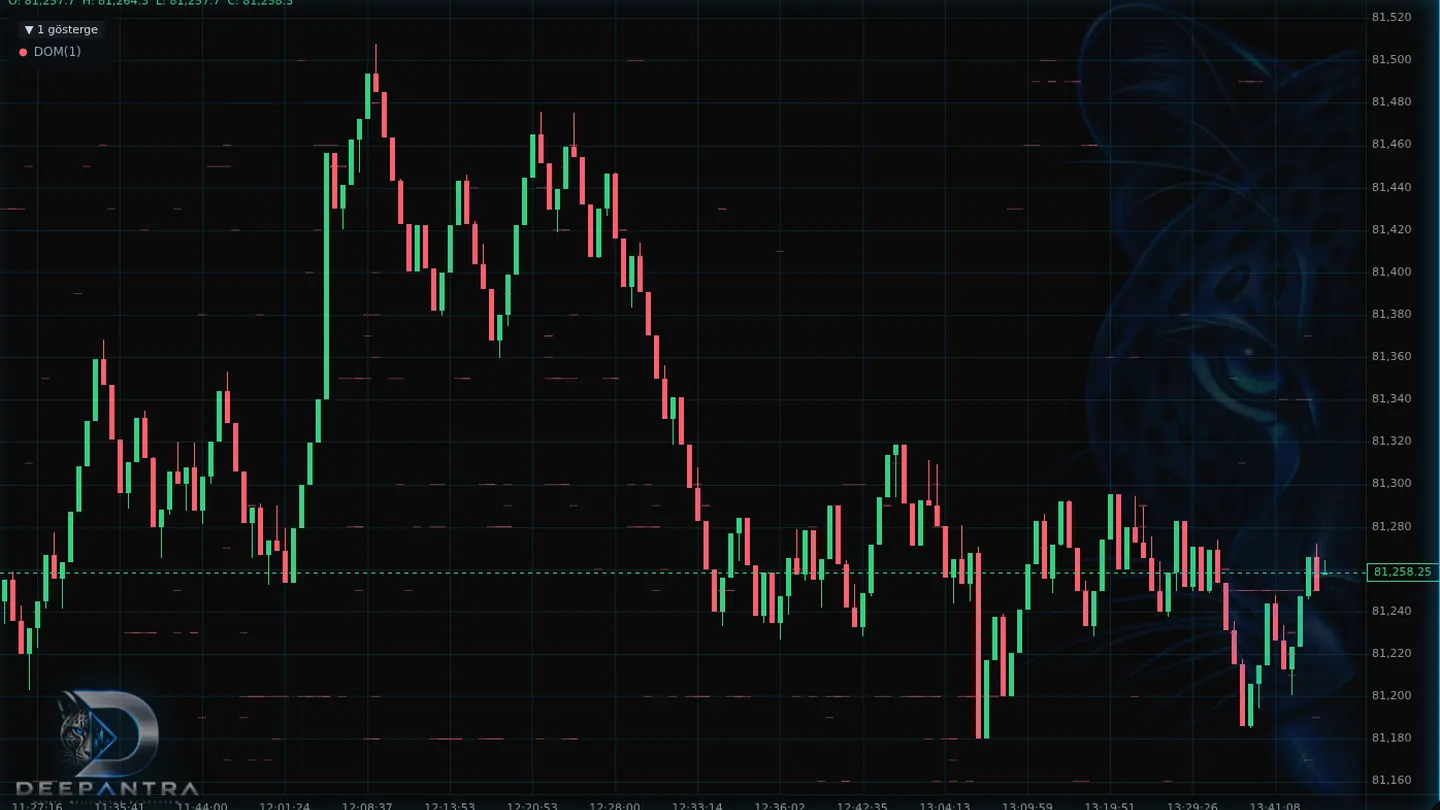
What it is
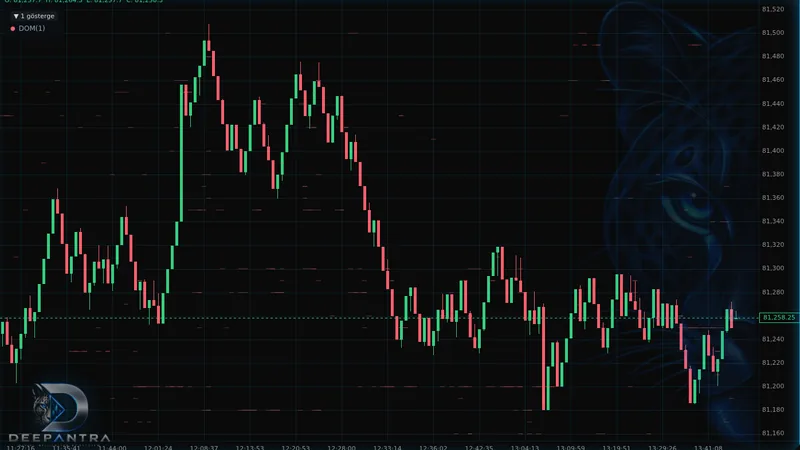
DOM Lines plot historical concentrations of resting market depth onto the ProChart canvas. They turn order-book history into visible liquidity context rather than a live book snapshot. Each line marks a price area where large depth previously appeared. Read them as a memory of where liquidity sat — not as a signal.